
Oil Market's Clock Has Changed Hands
The MOU did not end the oil crisis. It converted the inventory clock into a credibility clock, and the variables that matter now are vessels, insurance, and the August nuclear deadline, not draw rates


This is an update to "The Oil Market's Hidden Clock," published May 19, 2026. That piece built a bottom-up model of why Brent was not at $150 despite the largest oil supply disruption in recorded history. It identified four shock absorbers bridging the raw supply loss, calculated an operational inventory buffer of roughly 520 million usable barrels, and put the critical depletion window between June 14 and June 30. The MOU signed between the U.S. and Iran on June 15 arrived at the precise edge of that window. This piece updates the model.

The Original Thesis Was Right, for the Right Reasons
The central argument in May was that the market was not ignoring the shortage. It was pricing it correctly given the buffer. A raw supply loss of approximately 11.8 million barrels per day sounded catastrophic, but after accounting for demand destruction of roughly 4 million bpd, a record IEA-coordinated strategic reserve release of 400 million barrels, substitution supply from non-Middle Eastern producers, and China’s opaque but substantial reserve behavior, the residual deficit was closer to 2 million bpd. That is why Brent was at $100, not $150. The market was not broken. It was pricing a bridged deficit with a resolution probability discount.
The model also said the buffer was finite, and it produced a specific deadline: at Goldman Sachs’s April draw rate of 11.5 million bpd, the usable buffer would be exhausted around June 14. At the EIA’s more conservative 8.5 million bpd estimate, the same buffer would last to June 30. The MOU was signed on June 15. The clock did not fail. It was answered, on schedule.
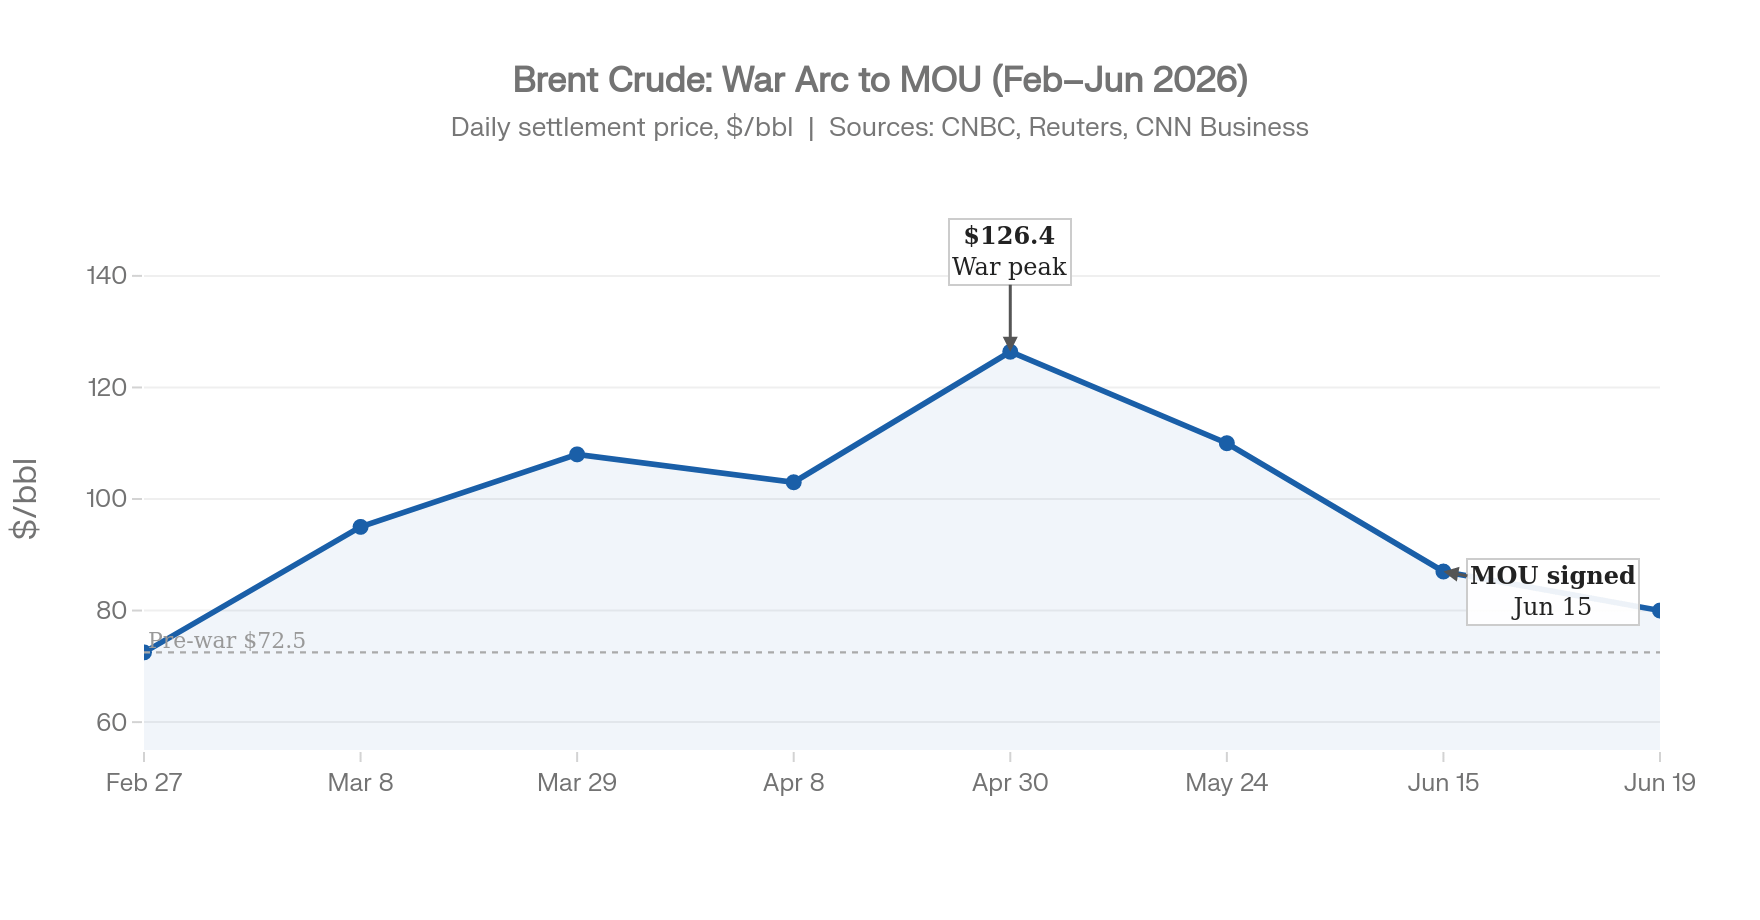
That timing matters analytically. The market’s sell-off from the $126.4 peak in late April to the low $80s today was not irrational. It was a rational forward pricing of a reopening that the model had pointed toward. Brent is not at $80 because the crisis is over. It is at $80 because the market believes the buffer will be refilled before it is fully consumed.
The Clock Has Not Stopped. It Has Changed Hands.
Here is the critical update to the framework.
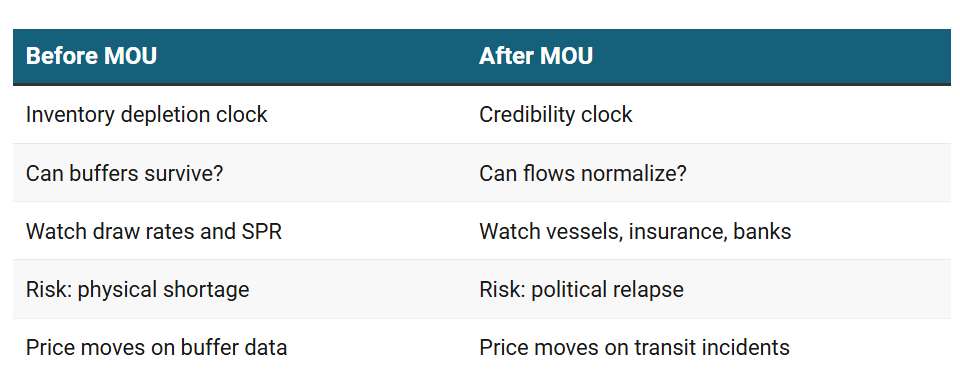
Before the MOU, the oil market was running an inventory depletion clock. The question was mechanical: can the four shock absorbers keep the system alive until a deal is reached? The variables to watch were draw rates, strategic reserve levels, Dated Brent premiums, and whether Southeast Asian economies began reporting physical shortages.
After the MOU, that clock has stopped. A new one has started. Call it the credibility clock.
The credibility clock runs on a different set of questions. Not “will the buffer run out?” but “will the reopening actually hold?” The risk has shifted from physical shortage to political relapse. The variables that mattered before, inventories, draw rates, SPR levels, now matter less than vessel transit counts, insurance market behavior, banking channel restoration, and whether the August nuclear deadline produces a framework or a breakdown.
This is not a subtle distinction. It changes what to watch, what to hedge, and how to think about the asymmetry of risk from here.
The market has priced most of the transition already. The remaining question is how much credibility premium still needs to be compressed, and what events could reprice it violently upward.
What the MOU Actually Buys
Understanding the deal’s structure is essential to understanding why the credibility clock runs the way it does.
The MOU is not a peace agreement. It is a tiered liquidity instrument with a nuclear file attached to the back end. The immediate benefit to Iran is explicit: Paragraph 10 grants Iran the right to sell crude oil and petroleum products upon signing, and extends waivers to the banking, transportation, and insurance services required to complete those transactions. That last clause is not formality. War risk insurance had surged from pre-war rates near 0.1% to levels exceeding 1,300% of hull value, with major P&I clubs canceling Gulf coverage entirely. VLCC daily freight rates hit a record $423,736 per day in early March, up 94% from pre-conflict levels. Without the banking and insurance waivers, oil-export permission is operationally meaningless. The waiver structure is the mechanism that makes physical trade possible again.
The conditionality, however, runs in one direction. Iran’s frozen asset pool of roughly $100 billion remains locked, pending the 60-day nuclear negotiation window. The $300 billion reconstruction fund, which both sides have discussed but which the U.S. has explicitly refused to fund itself, remains contingent on nuclear compliance. Full sanctions termination is deferred to the final agreement. Tehran gets cash flow now. Washington keeps conditional leverage over everything larger.
There is also a legal constraint the forward curve has not fully priced. Several legal analysts have noted that certain congressionally-mandated sanctions regimes may limit the executive branch’s unilateral waiver authority. If those constraints materialize in the form of court challenges or congressional opposition in coming weeks, the timeline for insurance and banking normalization stretches longer than the diplomatic timeline implies.
The model implication is straightforward: the MOU bought time, not resolution. It converted the acute pressure of a failing buffer into a 60-day negotiation window. What happens inside that window is what the credibility clock is measuring.
The Three Tests
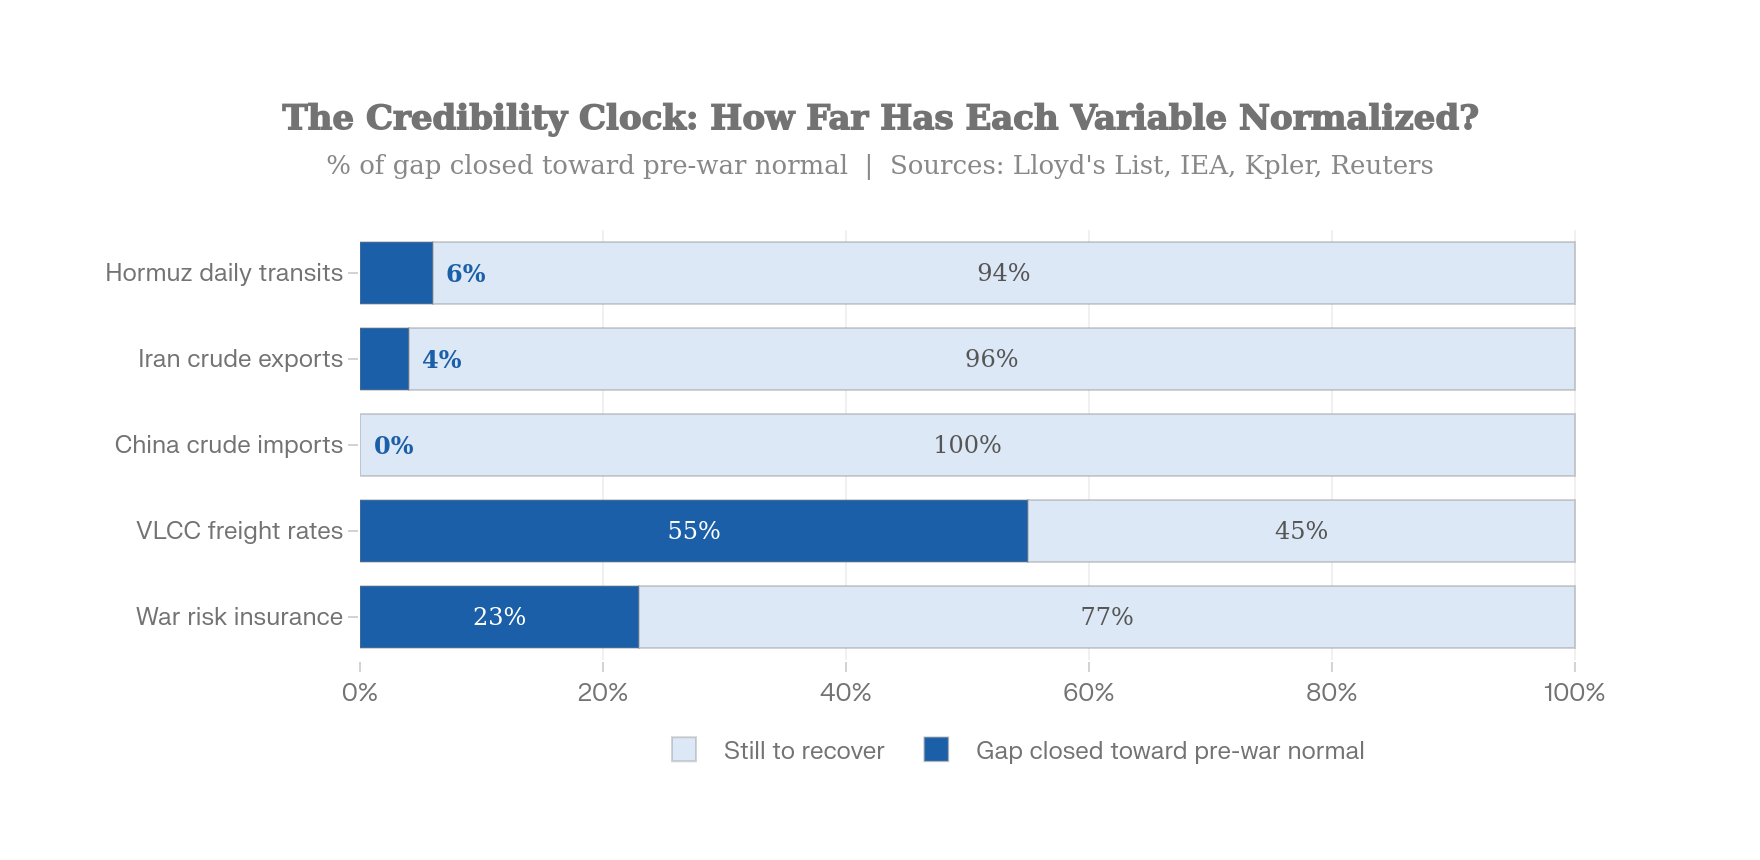
The original article identified three triggers for when the market would stop pricing a temporary event and start pricing a structural failure. Those triggers have now evolved into three tests for the credibility clock.
