
The Third Guidance Raise: Cheniere Energy (LNG)
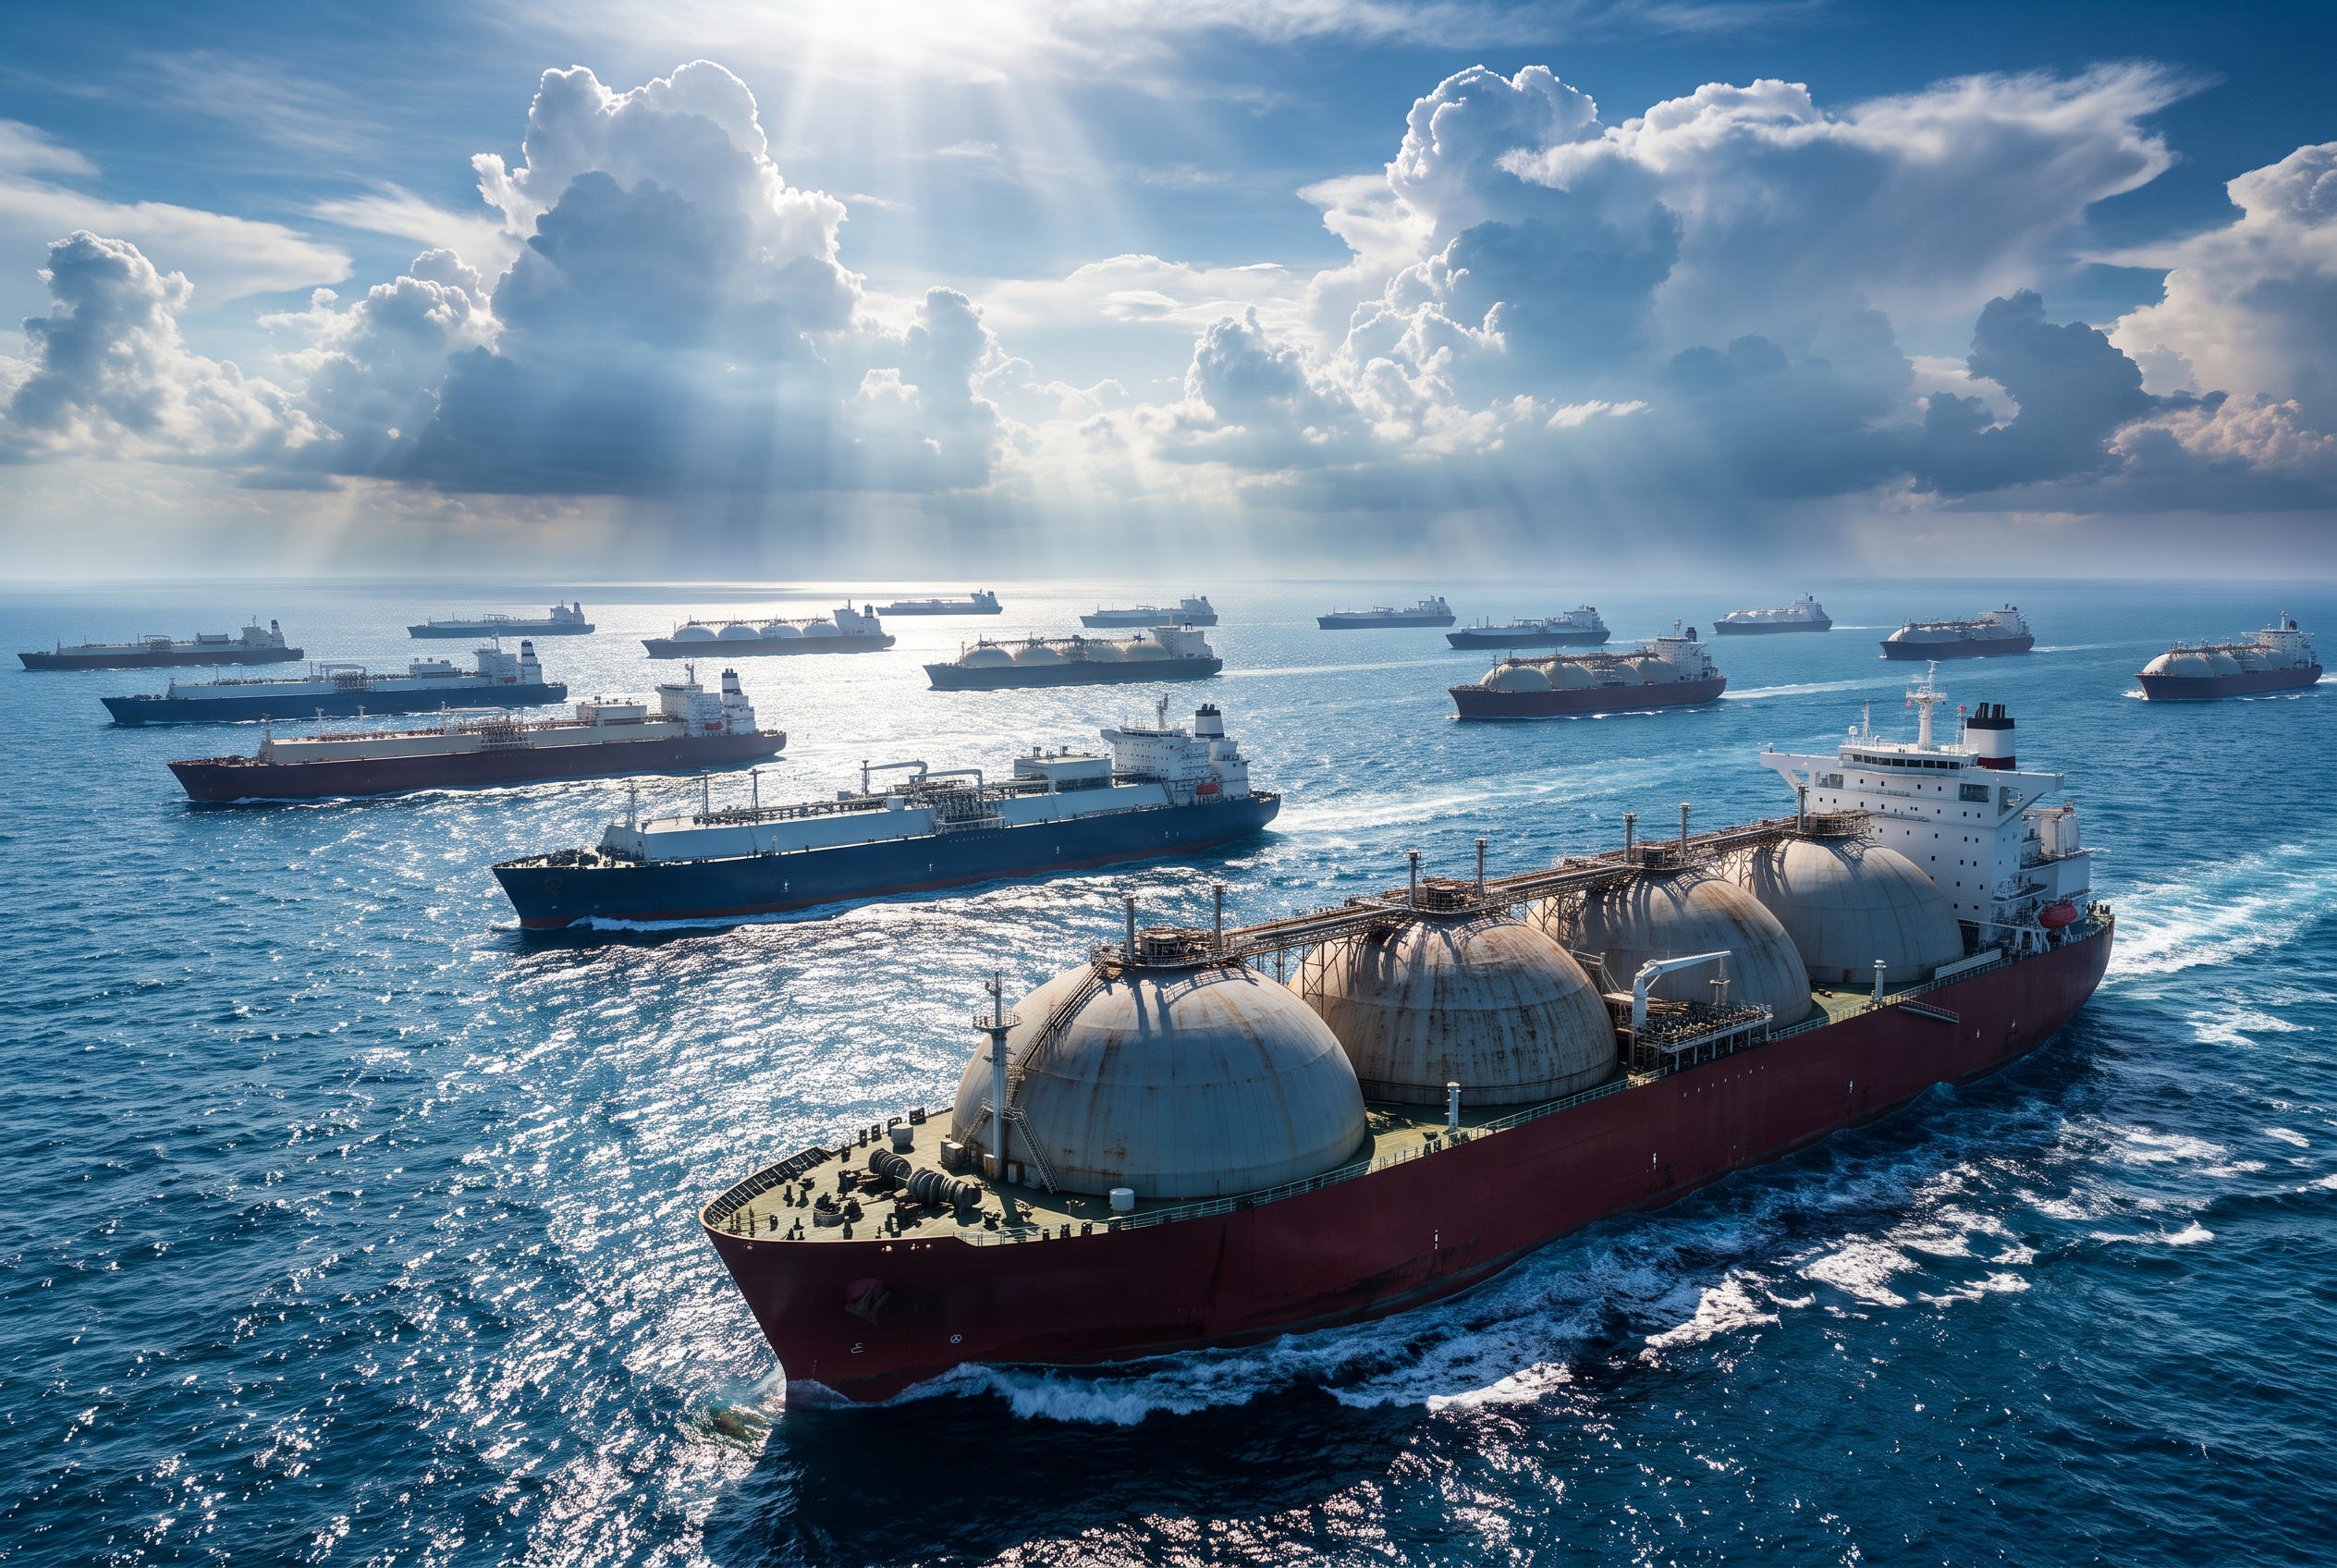
After the ceasefire, crude tanker traffic recovered to a quarter of pre-war levels. LNG carriers came back at under a tenth. That gap decides this winter.

Disclaimer: This article is for informational and educational purposes only. It does not constitute financial, legal, or investment advice. Views are based on public information as of the publication date and are subject to change.
Positioning has not changed much since the semiconductor drawdown in July. Most retail portfolios are still concentrated in tech and the AI buildout. Meanwhile something less discussed has happened to the global energy system: it has run out of slack.
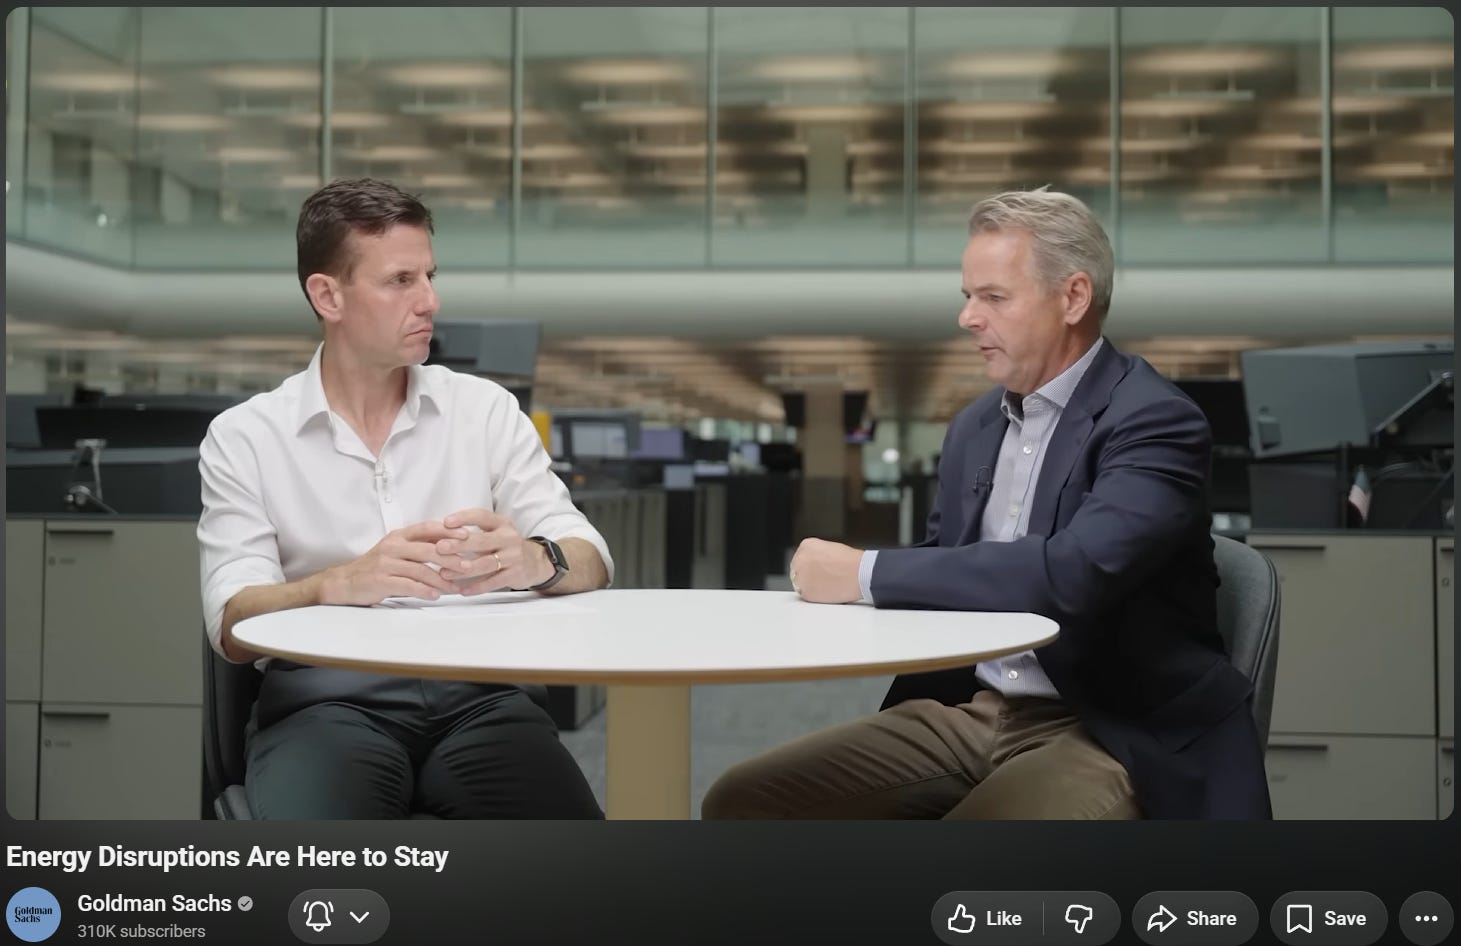
Jerome Dortmans, co-head of global oil and products trading at Goldman Sachs, opened the latest Macro Call with this: the worst on the crude side may be behind us, but the damage is still there, and the longer it goes on the more we need a supply response. Without one, expect price inflation. The part worth sitting with is “the damage is still there” and “without one.”
On August 6, Cheniere Energy (NYSE: LNG) reported second quarter results and raised full year EBITDA guidance for the third time, from $7.25 to $7.75 billion up to $7.9 to $8.4 billion. The new floor sits above the old ceiling. That has now happened two quarters running.
Sell side consensus calculated the same day puts 2027 EBITDA at $7.68 billion, which is 4.1 percent below 2026.
This piece covers three things: how the company actually earns money, what the second quarter proved, and where the gap between consensus and management sits.
If you have never looked at this sector, the first two sections will get you up to speed.
How Cheniere actually makes money
Cheniere is the largest LNG exporter in the United States. It runs two facilities, Sabine Pass in Louisiana and Corpus Christi in Texas. The business is straightforward: buy natural gas off the US pipeline grid, chill it to minus 162 degrees Celsius until it turns liquid, load it onto ships.
Revenue splits into two layers, and that split explains almost everything that follows.
Layer one is long term contracts, roughly 87% of volume. The typical pricing formula is 115 percent of Henry Hub plus a fixed liquefaction fee. Henry Hub is the US benchmark gas price, the gas equivalent of WTI. Customers pay a price that floats with Henry Hub, and Cheniere keeps the fixed fee plus the 15 percent spread. Contracts usually run ten years or longer. Counterparties are sovereign buyers and large utilities, more than 35 of them, on take or pay terms. International gas prices can do whatever they want and this cash flow barely moves.
Layer two is marketing, roughly 13% of volume. This is spot linked and captures the full spread between TTF (the European benchmark) and JKM (the Asian benchmark). War premium, regional arbitrage, cargo rerouting, all of it lands here.
The structure means downside is anchored by contracted cash flow and upside comes from the marketing book. Management guides long run marketing margins at $2.50 to $3.00 per MMBtu. In the second quarter of 2026 they were realizing $10 to $13.
What I wrote in March, and what I got wrong
On March 24 I published a piece called “Cheniere Energy Inc: The Swing Supplier”. The argument was that the consensus revenue per unit assumption for Cheniere’s 2026 was $7.49 per MMBtu, a number set before the recent Iran war, while Ras Laffan was still loading normally and the North Field East expansion was still slated for November startup. After March 3, two liquefaction trains at Ras Laffan were destroyed, the QatarEnergy CEO told Reuters repairs would take three to five years, and $7.49 was still sitting in the models.
That piece carried a probability weighted target of $370.
On April 30 I published a correction. The heaviest pillar in the original argument was that JKM 2027 futures were already trading at $20. That figure was taken near the early March spike. The actual JKMK7 contract (May 2027) was settling around $13 at the time, with the deeper 2027 strip at $11 to $13. The forward curve did not support the multi year structural premium I had claimed. I had also conflated two different trades, being long the LNG equity and being long deferred JKM. Stripping that leg out, the reasonable ceiling came down to $310 to $330.
That correction looks more useful in hindsight than it did at the time. It moved the thesis off “bet on the forward curve” and onto “watch what the company actually delivers.” What followed made the second approach the more reliable one.
The defining event of the first quarter print on May 7 was a $3.5 billion GAAP loss. That was a non cash mark to market charge on long dated IPM contracts, not a real loss. Algorithms and retail saw EPS of negative $16.65 and sold. The stock traded down to $244 premarket. I called it accounting noise. Second quarter GAAP net income came in at positive $3.068 billion, a complete reversal.
More importantly, the machine that generated that noise has now been switched off. More on that below.
Q2 2026 Earnings
Herre’s a quick overview of actual results vs. consensus and the year ago period:
Revenue of $5.732 billion, against consensus of $4.92 billion, up 23.5% year over year. The revenue beat was 16.5%, which is an unusually wide miss for a company this heavily covered (20+ sell side institutions cover this stock).
Consolidated adjusted EBITDA of $1.804 billion, against consensus of $1.72 billion, up 27.4%.
Distributable cash flow of roughly $1.17 billion, against consensus of $1.13 billion, up 27.2%.
Net income attributable to common shareholders of $3.068 billion, against $1.626 billion a year ago.
Diluted EPS of $14.65, against $7.30.
184 cargoes exported, 672 TBtu loaded, against 154 cargoes and 550 TBtu a year ago.
One detail that got no attention: 672 TBtu loaded, but only 657 TBtu recognized in income. The difference came from cargoes rerouted from Europe to Asia mid quarter, pushing delivery into the third quarter. That volume is already produced and already sold, just deferred. It becomes a tailwind in Q3. The same mechanic worked against them in Q1 and for them in Q2.
Three raises, and what drove this one
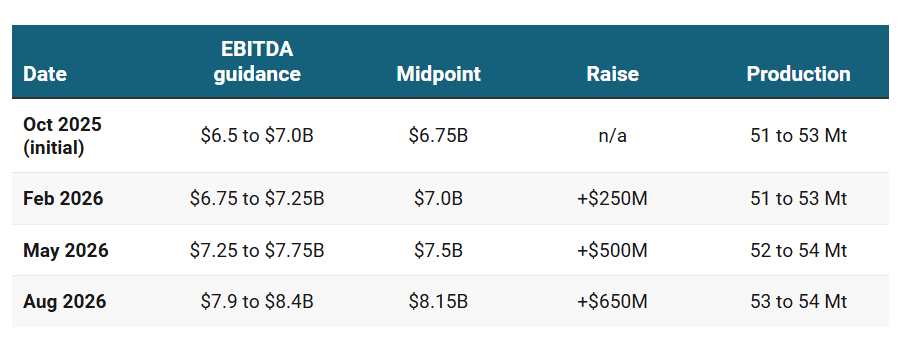
Cumulative increase of $1.4 billion, or +21%. Each raise has been larger than the one before it.
CFO Zach Davis broke down the $650 million on the call without being asked twice. Half a million tonnes of additional production at $10 to $13 margins contributed about $300 million. Placing the remaining unsold volume plus a Henry Hub uplift added about $200 million. Optimization activity locked in year to date added $100 to $150 million.
The composition matters more than the number. Davis explicit: moving from 51 to 53 Mt at the start of the year up to 53 to 54 Mt now, “only a third of that, if that” came from the Stage 3 ramp. More than two thirds came from reliability improvements and debottlenecking.
The specifics are worth knowing. New fin fans developed with Hudson deliver over 40 percent more airflow at the same motor amperage, which helps considerably at Sabine Pass during summer heat. The feed gas composition problems that hit them in the first quarter of 2025 were traced to root cause and fixed. Defrost cycles are down, unplanned downtime is down, maintenance windows have compressed. Jack Fusco’s characterization was that all of it is repeatable year over year.
That distinction drives the multiple. One time war premium does not deserve a re rating. Durable operating efficiency does.
Guidance now runs ahead of the current pace
Last quarter I flagged that management’s implied second half guidance sat below where the sell side had it, meaning guidance was deliberately conservative. That has flipped.
First half EBITDA came in at $4.137 billion. Full year guidance at the midpoint is $8.15 billion, which implies $4.013 billion for the second half, or a quarterly average of $2.007 billion. Second quarter actual was $1.804 billion.
Guidance now implies a second half quarterly run rate 11% what they just delivered. First time that has happened this year.
The supporting factors are all specific and checkable. No major turnarounds remain this year, and all resiliency work finishes by the end of August. Train 7 at Corpus Stage 3 is in commissioning with first LNG imminent, and substantial completion is running well ahead of the contractual guarantee date in 2027. Fourth quarter ambient temperatures are lower, which improves liquefaction efficiency, and Q4 has historically been the highest production quarter. Add the Q3 recognition of those rerouted cargoes.
A fourth raise in November looks inevitable to me.
The mismatch sits in 2027
This is the part that matters most.
I updated my model vs. the consensus (as of Aug 7, 2026):
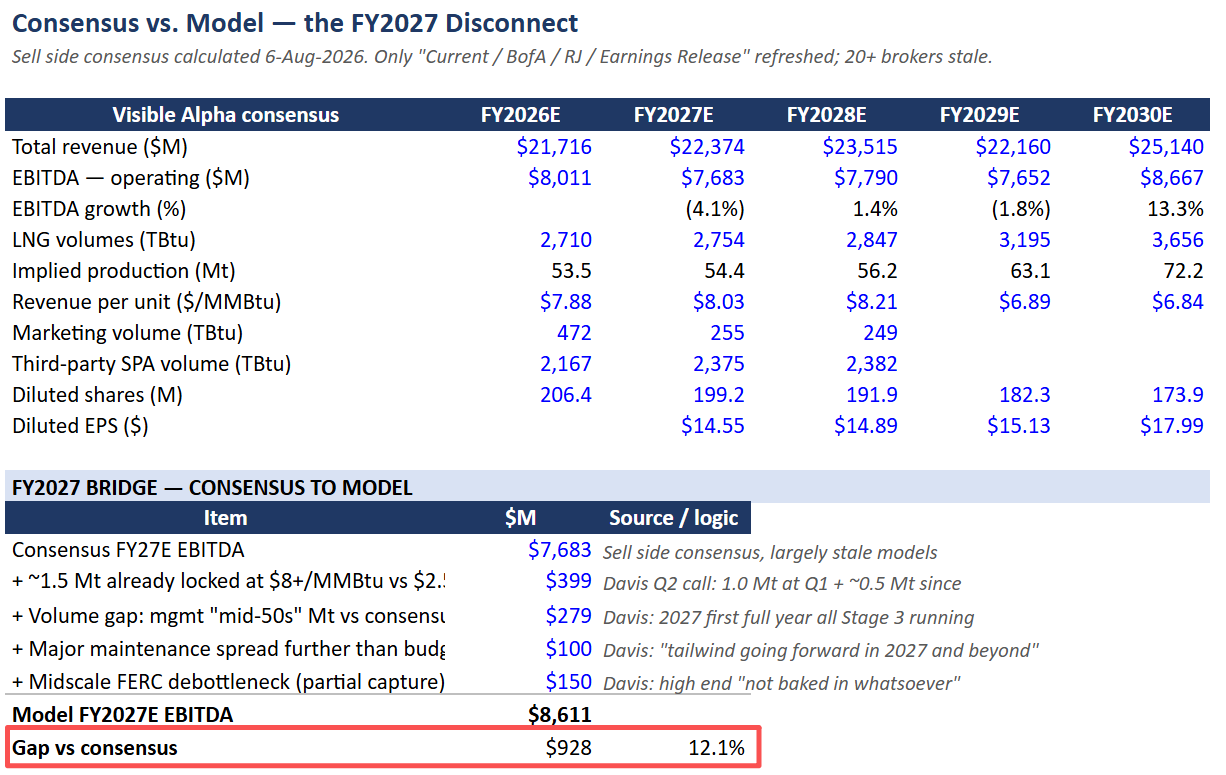
Consensus has 2027 EBITDA falling 4.1 percent from 2026.
Management spent the same call arguing the opposite. Before touching a single financial figure, Davis led with this:
“I wanted to reinforce that this highly contracted investment-grade LNG infrastructure company has been built for much more than as a trading proxy for prompt LNG prices... These forecasted results of $8-plus billion of EBITDA are levels we plan on achieving in run rate as we simply build out the Corpus midscale trains and FID SPL Train 7 by early 2027. And that’s in an LNG market environment of not over $10 LNG margins, but at a fraction of that in our $2.50 to $3 margin range before any upside.”
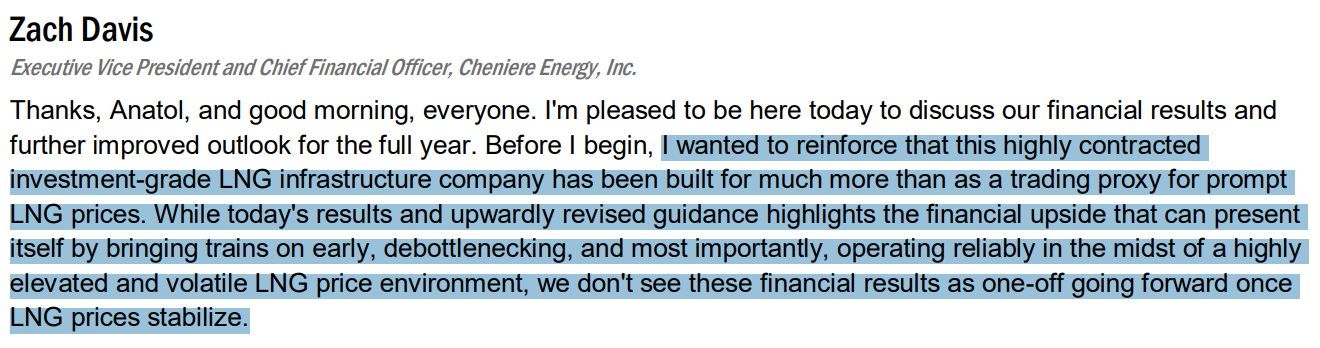
A CFO opening prepared remarks by arguing his own stock should not be traded as a gas price proxy is itself a signal. He is saying:
Take the war out, price the margins at $3 instead of $12, add the trains already under construction, and $8 billion of EBITDA still holds.
The consensus build has two problems that can be checked individually.
First, the marketing assumption. Consensus cuts marketing volume from 472 TBtu in 2026 to 255 TBtu in 2027 while adding 208 TBtu to third party SPA volume. Directionally that makes sense, since new Stage 3 volume gets progressively contracted. But it removes almost all of the 2027 optionality. Davis disclosed on the call that they have already locked roughly 1.5 million tonnes for 2027 (1.0 Mt as of last quarter’s call, another 0.5 Mt since) at margins above $8 per MMBtu, which in his words is “well above run rate levels.” That 1.5 Mt is about 76 TBtu. At $8 against a $2.75 run rate, that single item is close to $400 million.
Second, the volume assumption. Consensus has 2,754 TBtu for 2027, roughly 54.4 million tonnes. Davis said: “we’ve given guidance that it’s kind of in the mid-50s when we have Stage 3 up and running and there’s nothing holding that back.” Consensus sits about a million tonnes below management’s own framing, and that excludes the roughly 5 mtpa of midscale capacity increase FERC has already approved. Asked directly about that, Davis said if you go to the high end of those approvals, it is “not baked in whatsoever.”
The accounting noise has been switched off
In mid June, Cheniere designated the normal purchase and normal sale accounting exception for roughly 75 percent of its IPM contract volumes. Six of the eight agreements, specifically the ones delivered straight into Sabine and Corpus, not optimized, liquefied and sold at a global price.
Those contracts no longer get marked to fair value each period. No more derivative accounting adjustments on that volume in future quarters.
Davis quantified the effect. Of the 22 quarters since 2021, six produced a net loss because of unrealized derivatives. Had this designation been in place earlier, that number would have been two.
This removes the exact mechanism that triggered the panic in the first quarter. For quant screens and retail investors filtering on GAAP EPS, the false signal rate drops sharply.
Goldman’s read: the Strait is a dial, not a switch
The market’s default framing of the Middle East is binary. The strait is open or closed, the ceasefire is signed or it isn’t. The Goldman trading desk does not model it that way.
Dortmans gave the numbers. Pre war, roughly 15 million barrels per day of crude transited Hormuz. After the conflict, even routing around through Fujairah and Yanbu, that fell to around 7 to 8 million. Products ran about 5 million barrels per day pre war. Flows rebounded above 10 million during the early phase of the June MOU, then fell back to mid war levels after the latest escalation.
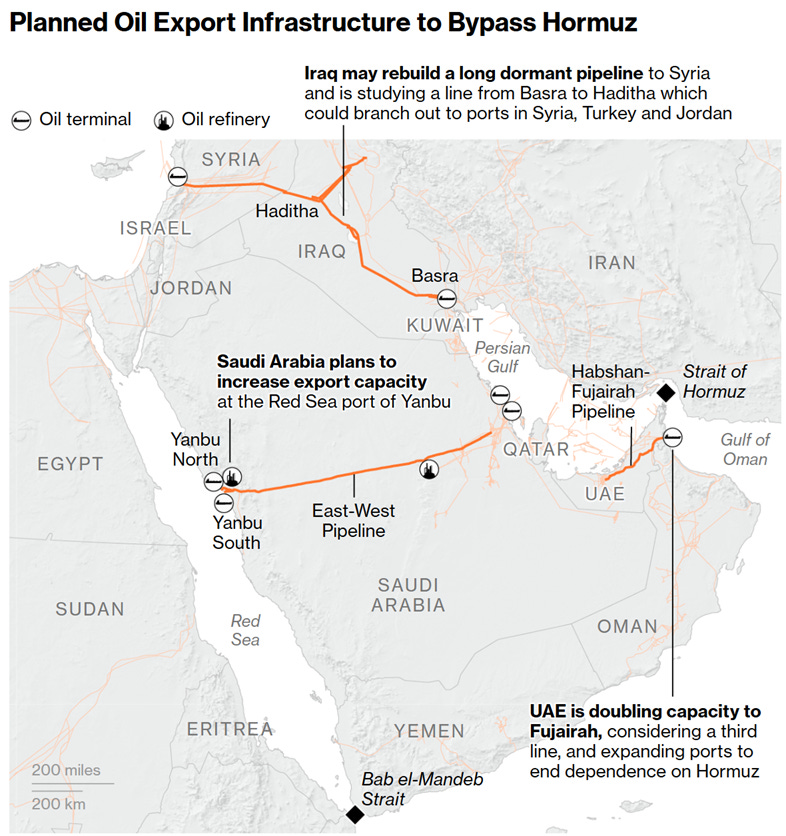
The point is that each link in the chain can fail independently. Whether a ship can sail is different from whether the owner will sail it. Willingness to sail is different from whether an insurer will write the cover. Getting cover is different from what happens to freight rates and war risk premiums. Crude finding a workaround is different from products, LPG and LNG finding one. Physical flow recovering is different from downstream customers, inventories and refinery scheduling normalizing.
Cheniere’s chief commercial officer Anatol Feygin supplied the precise validation of this framework on the call: after the mid June ceasefire, crude tanker transits recovered to roughly 25 percent of the pre conflict average, while LNG tanker transit recovery was under 10 percent.
His explanation of why: unlike crude, LNG requires upstream gas supply, liquefaction, marine logistics and vessel scheduling to all return to normal before exports can recover. And “long distance cryogenic pipelines are simply not an option.”
Goldman’s other escalation point is the Red Sea, which is now also constrained. That means the route that would substitute for Hormuz is degrading at the same time. This is a two node failure. The problem is not one road closing, it is the main road and the detour both getting worse together.
Dortmans also noted that traders have become desensitized to headlines about the US agreeing to talk again. What they now require is sustained physical throughput, not a statement or a memorandum.
The tail risk is a European winter
Goldman splits the energy shock into five layers: crude, refining, products, shipping and winter gas. The market watches the first one. They believe the last one is the least priced.
Dortmans, verbatim: European storage levels are at historically low levels, and injection will not reach the kind of levels that historically made the market comfortable. A mild winter and they might just get away with it. A normal winter and they will struggle. A cold winter and, in his words, “we’re probably in a whole lot of bother in terms of price response.”
This is not a weather bet in the ordinary sense. When inventory is thin, weather converts linear risk into non linear risk.
The numbers:
EU storage stood at roughly 57 percent in early August, the lowest level on record for that date, below 2011. A year ago it was around 69 percent. The five year average is around 70 percent.
Feygin’s framing was that Europe exited the second quarter with a storage deficit of roughly 11 BCM against last year, equivalent to about 100 LNG cargoes.
The EU has already cut its winter storage target from 90 percent to 80 percent, with a further deviation allowance on top.
Feygin’s own view in the Q&A was more pessimistic than the official target: “we think it’ll be tough to get to 70%, much less 80% of inventory.”
For reference, the 2025 to 2026 winter began with storage 82 percent full and ended in March at 28 percent.
Feygin also gave two rules of thumb you can drop straight into a model:
Each additional month of constrained Hormuz LNG flows reduces Europe’s storage position by roughly 5 percentage points, and that carries through from winter start to winter exit. A winter that runs 1 degree Celsius warmer or colder than normal moves the balance by roughly 10 percentage points.
At the same time, the shock absorber that soaked up the last two years of supply disruption is running out. China’s first half LNG imports fell 10 percent to roughly 27 million tonnes, absorbed through domestic production, pipeline gas, fuel switching and reselling flexible cargoes. But Feygin said recent months have run at or above last year’s levels, and that China “as a system, will be keenly aware of its inventory levels and will not allow itself to get into the position that, unfortunately, Europe has found itself in.” His conclusion was that China is “at kind of at its limit for solving this issue for the world.”
Put the pieces together.
Europe enters winter with the lowest storage on record for the date. 12.8 million tonnes of Qatari capacity stays offline for years. LNG transit through Hormuz has recovered to under 10 percent of pre war levels. China’s flexibility is spent.
What the market is already paying for
I value this on distributable cash flow per share rather than EV/EBITDA. Cheniere’s consolidated EBITDA includes 100 percent of Cheniere Energy Partners while the parent owns roughly half, so EV/EBITDA requires a large and imprecise minority interest adjustment. DCF is measured at the parent level after minority distributions, and it is the cash that actually funds buybacks and the dividend.
Where things stand: 2026 DCF guidance midpoint of $5.55 billion divided by 206.44 million shares gives $26.88 per share. At $264.32, that is 9.8 times P/DCF and a 10.2 percent free cash flow yield.
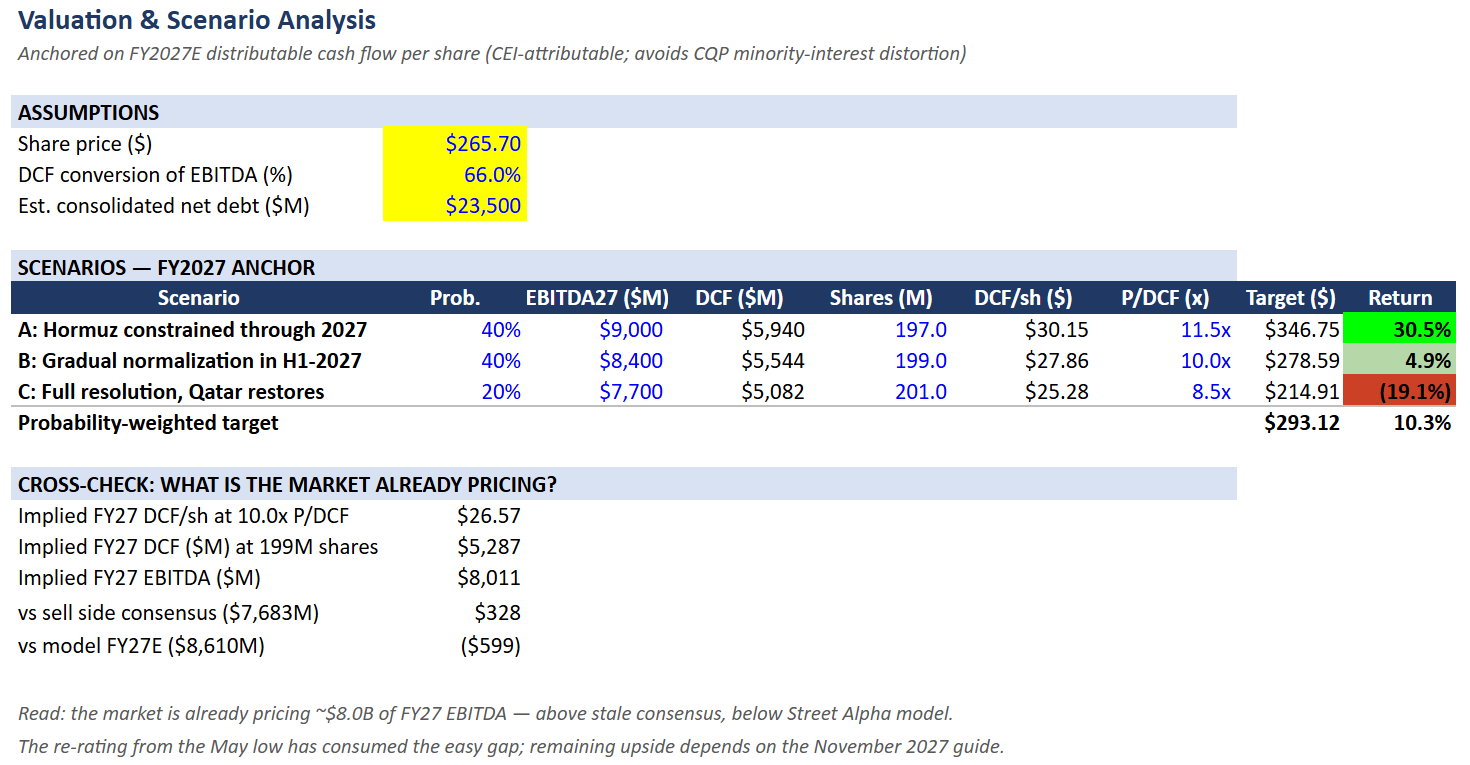
Scenarios anchored on 2027, using a 66 percent DCF conversion rate:
Scenario A, Hormuz stays constrained through 2027 (40 percent). EBITDA of $9.0 billion, DCF per share of $30.15, at 11.5 times gives $347.
Scenario B, gradual normalization in the first half of 2027 (40 percent). EBITDA of $8.4 billion, DCF per share of $27.86, at 10.0 times gives $279.
Scenario C, full resolution with Qatar restoring supply (20 percent). EBITDA of $7.7 billion, DCF per share of $25.28, at 8.5 times gives $215.
Probability weighted, $293.
More informative than that number is the reverse calculation. At $264 and a 10 times P/DCF multiple, the market is implicitly paying for roughly $7.97 billion of 2027 EBITDA. That is above the consensus of $7.68 billion and below my model at $8.61 billion.
In other words, the move from $224 at the end of May to here has already absorbed the stretch where consensus catches up to management guidance. What remains depends on whether the 2027 production forecast and open capacity disclosure in November comes in higher.
Cross checking against 2028: management’s $8 billion plus run rate, call it $8.5 billion, at 192 million shares gives $29.22 per share, which is $292 at 10 times and $321 at 11 times. That lands in the same zone as the scenario weighted $293 and the sell side average of roughly $304.
The balance sheet and what comes next
These items support the long run cash flow and are worth listing separately.
Buybacks. 2.2 million shares for $550 million in the second quarter. Roughly 5 million shares for $1.1 billion in the first half. Share count is now below 207 million, and management’s path is to cross under 200 million and then work toward a target of 175 million later this decade. Over $1.3 billion returned to shareholders in the first half through buybacks and dividends.
Dividend. Currently $0.555 per quarter. Board approval for an increase will be sought at the third quarter, with a commitment to at least 10 percent annual growth through 2030.
The next growth project. The SPL Expansion Phase 1 reached a milestone in the second quarter with a $4.7 billion lump sum turnkey EPC contract signed with Bechtel. Baker Hughes supplies the gas turbines and compressors. Limited notice to proceed has been issued and early engineering and critical equipment procurement are underway. The scope covers one large scale train at Sabine Pass at roughly 5 million tonnes, plus a boil off gas re liquefaction unit that adds about 1 million tonnes across the whole facility. Total is over 6 million tonnes per annum, roughly 10 percent platform growth. This is a heavily brownfield project requiring no additional marine berths, no new storage tanks and no significant new pipeline investment. Regulatory approvals are expected later this year with FID in early 2027. Financing is 50 percent debt and 50 percent equity cash flow.
Projects under construction. CCL Stage 3 is over 98 percent complete. Train 6 achieved substantial completion in June. Train 7 has first LNG imminent. Midscale Trains 8 and 9 are over 48 percent complete with piling finished and tracking ahead of schedule.
Platform ceiling. Over 40 million tonnes per annum sits in the permitting process. Management believes the platform could exceed 100 million tonnes per annum.
What would break this
The counterevidence, and the most important piece of it came from management.
Competition in the long term contract market is getting worse. Feygin pointed out that from the start of 2025 through today, over 100 million tonnes of capacity has taken FID globally, and a large share of it has not found end users. That volume needs homes. Asked whether he could sign more long term contracts at the $2.50 to $3.00 premium level, his answer was that he is confident about the mid single digit millions of tonnes over the next 12 to 18 months needed to support Corpus Phase 1, but: “Am I comfortable that 20 million tonnes can be done at that level today? That’s, I’m less comfortable with that.”
That is the genuine risk to the post 2029 story, and it has nothing to do with the war.
Other conditions that would invalidate the view:
A credible, financed repair timeline for the Qatari south site inside 12 months. Force majeure is currently long term and was still widening in early August.
European storage surprising above 75 percent before the end of October.
JKM sustaining below $12. It is currently above $18.
Valuation. The stock is up roughly 18 percent from the May low. At 9.8 times P/DCF it is neither cheap nor expensive. During the 2022 to 2023 European energy crisis it traded between 9 and 11 times, briefly touching 11.5. Breaking above that requires the market to accept this as a structural re rating rather than a cyclical premium.
Why energy earns a slot right now
This section is about the macro, not the single name.
The most useful inference from the Goldman interview concerns policy constraints rather than energy itself.
If tightness in diesel, jet fuel, LPG and natural gas is rolling and crosses seasons, the floor under inflation rises, and it rises for supply side reasons rather than demand overheating. Supply side inflation has an awkward property: central banks have no good tool for it. Raising rates does not conjure refining capacity or liquefaction trains into existence. But slowing growth does not justify easing either.
That means the familiar sequence, where oil rises, growth slows, the Fed cuts and equities get rescued, may not run.
AI infrastructure also does not sit outside the physical energy system. Data centers need stable power, gas fired generation, transmission, transformers, switchgear, diesel backup, copper, aluminum, steel and global logistics, plus long duration financing at tight credit spreads. Energy tightness cuts both ways here. Policy support for grid and generation investment gets stronger, while real construction costs and financing costs go up, particularly for projects without firm power contracts or strong balance sheets.
The most counterintuitive point in the Goldman interview deserves its own line:
Even if crude drifts back into the $70s in the fourth quarter, that does not mean energy inflation is over.
In their framework, falling crude can coexist with tight products, low inventories and elevated winter gas risk.
Against that backdrop, energy infrastructure with contracted cash flow visibility, a high free cash flow yield and direct exposure to physical bottlenecks carries a different risk profile than long duration growth assets. For Cheniere specifically, the numbers are: 87 percent of volume locked into ten year plus fixed fee contracts with sovereign buyers and large utilities, a 10.2 percent free cash flow yield, a buyback program over $10 billion targeting a reduction from 207 million shares to 175 million, and guidance that has now been raised three consecutive quarters for a cumulative 21 percent.
What to watch
Company:
The 2027 production forecast and open capacity disclosure on the November third quarter call. This is the event that forces consensus to move. Our model points to roughly $8.5 billion against consensus at $7.68 billion.
The size of the third quarter dividend increase.
Substantial completion of Train 7 at Corpus Stage 3.
Regulatory approval and early 2027 FID on the SPL Expansion.
Contracting progress at Corpus Phase 1, targeting mid single digit millions of tonnes over 12 to 18 months.
Market:
Actual LNG tanker transits through Hormuz, currently under 10 percent of pre war levels, rather than diplomatic statements.
European storage percentage and injection rates, currently 57 percent and the lowest on record for the date.
Updates on the repair timeline for the 12.8 million tonnes of Qatari capacity.
The shape of the JKM and TTF forward curves. A shift from backwardation toward contango would indicate the market is starting to accept structural tightness.
Diesel crack spreads. This is the single strongest signal in the Goldman framework and the most direct evidence of whether supply side inflation persists.
Closing
The March piece argued that consensus was using a pre war price assumption. The April piece corrected the part about the forward curve. The May print showed the GAAP loss was noise. The August print was the third guidance raise, and two thirds of it came from repeatable operating improvements.
The mismatch has moved. It is no longer in 2026, which is essentially locked, with under 50 TBtu of volume still unsold and a $1 move in margins worth less than $50 million to full year EBITDA. It sits in 2027, where consensus models a 4.1 percent decline, management spent an entire call arguing the other direction, and the twenty plus broker files behind that consensus have not been updated.
That gap gets tested in November.
Thank you for this very thorough analysis. Cheniere is one of my favorite stocks because it’s more of an infrastructure investment than say, a financial one. A productive real asset. It’s interesting that so many analysts 20+? … missed by such a wide margin. My biggest concern is the durability of their franchise. Any thoughts about that?